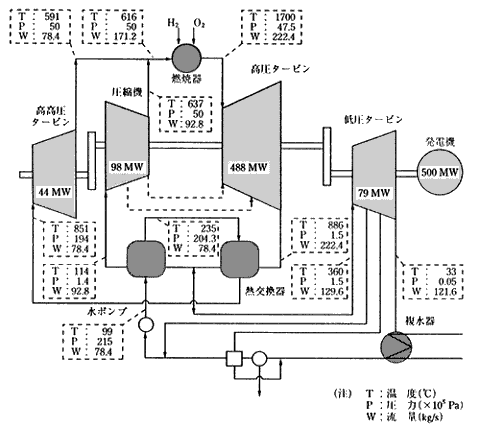
第1図 水素燃焼タービンシステム
Fig. 1 A diagram of a hydrogen combustion turbine
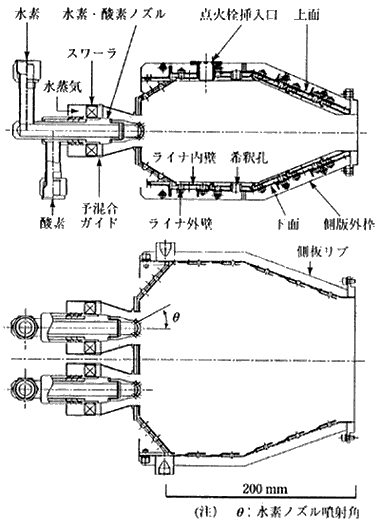
第2図 セクタモデル燃焼器
Fig. 2 Sector model of combustor
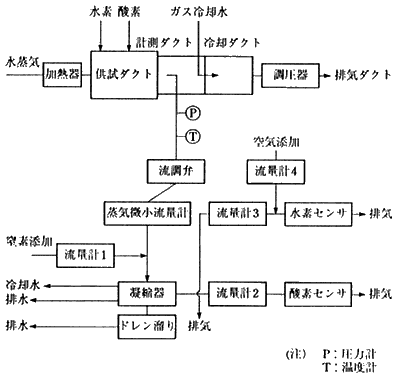
第3図 連続ガス分析装置系統図
Fig. 3 Flow chart of continuous gas analysis system
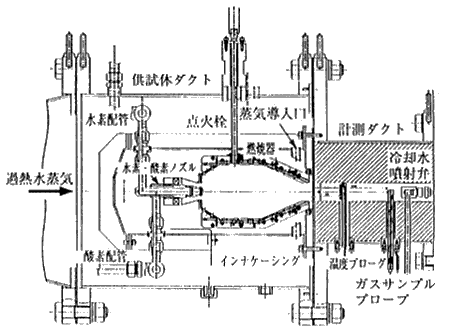
第4図 試験装置
Fig. 4 Test apparatus
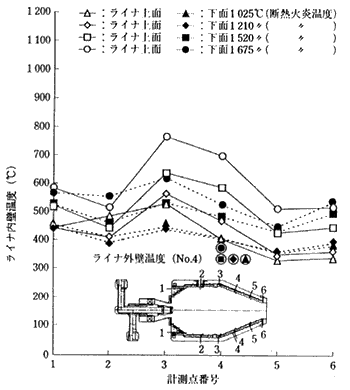
第5図 燃焼器ライナ壁温
Fig. 5 Combustor liner temperatures
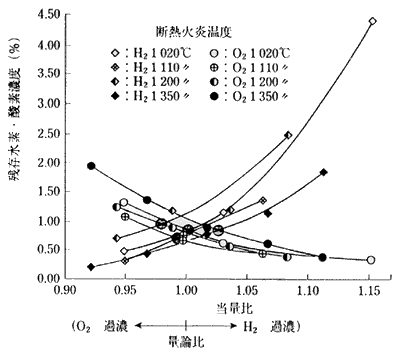
第6図 残存水素・酸素濃度
Fig. 6 Residual reactant concentrations
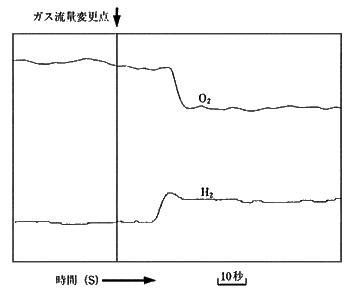
第7図 連続ガス分析装置応答性
(試験条件:当量比 0.94→0.96)
Fig. 7 Response time of the gas analysis system
(test condition: equivalence ratio, 0.94->0.96)
第1表 供試水素ノズル詳細(mm)
Table 1 Tested hydrogen nozzles
| 噴射角(θ) | 30○ | 35○ | 40○ |
| ノズルA噴射孔数一径 | 8-φ1.6 | 8-φ1.6 | 8-φ0.8 |
| ノズルB噴射孔数一径 | 8-φ1.2 | 8-φ1.2 | 8-φ0.8 |
第2表 燃焼器出口ガス温度(℃)
Table 2 Gas temperature at combustor outlet
| - | 計算値 | 計測平均値 | 計測最高値 | PTF |
| ノズルA | 1110 | 965 | 1060 | 0.154 |
| 1340 | 1183 | 1330 | 0.177 | |
| 1535 | 1393 | 1670 | 0.266 | |
| ノズルB | 1095 | 930 | 1010 | 0.138 |
| 1320 | 1155 | 1301 | 0.182 | |
| 1620 | 1457 | 1567 | 0.139 | |
| 1745 | 1574 | 1745 | 0.140 |